nagios: 安装、配置和使用
08 Jun 2016
1. 安装
0. 环境准备
# 环境包安装
yum install gcc glibc glibc-common gd gd-devel -y

# httpd,php安装
yum install httpd php -y
1.1 创建用户
# 创建nagios用户
useradd -m nagios
passwd nagios

# 创建nagcmd用户组,并将apache、nagios加入此组
usermod -a -G nagcmd nagios
usermod -a -G nagcmd apache
1.2 下载nagios及其插件
cd /usr/local/src
wget http://prdownloads.sourceforge.net/sourceforge/nagios/nagios-4.0.8.tar.gz
wget http://www.nagios-plugins.org/download/nagios-plugins-2.0.3.tar.gz
1.3 编译安装nagios
# 编译安装nagios
tar zxvf nagios-4.0.8.tar.gz
cd nagios-4.0.8
./configure --prefix=/usr/local/nagios --with-command-group=nagcmd
make all

# 安装主程序,CGIs和HTML文件
make install

# 安装init脚本(/etc/rc.d/init.d/nagios)
make install-init

# 安装配置文件(${prefix}/etc目录下)
make install-config

# 创建外部命令所在目录及配置其权限(${prefix}/var/rw)
make install-commandmode
扩展-编译安装选项
> If the main program and CGIs compiled without any errors, you
> can continue with installing Nagios as follows (type 'make'
> without any arguments for a list of all possible options):
>
>   make install
>      - This installs the main program, CGIs, and HTML files
>
>   make install-init
>      - This installs the init script in /etc/rc.d/init.d
>
>   make install-commandmode
>      - This installs and configures permissions on the
>        directory for holding the external command file
>
>   make install-config
>      - This installs *SAMPLE* config files in /usr/local/nagios/etc
>        You'll have to modify these sample files before you can
>        use Nagios.  Read the HTML documentation for more info
>        on doing this.  Pay particular attention to the docs on
>        object configuration files, as they determine what/how
>        things get monitored!
>
>   make install-webconf
>      - This installs the Apache config file for the Nagios
>        web interface
>
>   make install-exfoliation
>      - This installs the Exfoliation theme for the Nagios
>        web interface
>
>   make install-classicui
>      - This installs the classic theme for the Nagios
>        web interface
> ```

### 1.4 修改配置文件,配置报警邮箱
``` bash
# vi /usr/local/nagios/etc/objects/contacts.cfg
************************************
define contact{
        contact_name                    nagiosadmin
        use                             generic-contact
        alias                           Nagios Admin

        email                           someone@gmail.com
        }
************************************
1.5 配置web界面
## 安装web配置文件
# make install-webconf

## 准备nagiosadmin账户,用来访问nagios的web页面
# htpasswd -c /usr/local/nagios/etc/htpasswd.users nagiosadmin

# service httpd restart
1.6 编译安装nagios插件
# cd /usr/local/src/
# tar zxvf nagios-plugins-2.0.3.tar.gz
# cd nagios-plugins-2.0.3
# ./configure --prefix=/usr/local/nagios --with-nagios-user=nagios --with-nagios-group=nagios
# make
# make install
1.7 启动服务
# chkconfig --add nagios
# chkconfig nagios on

## 检查配置
# /usr/local/nagios/bin/nagios -v /usr/local/nagios/etc/nagios.cfg

# service nagios start
1.8 检查访问

如不能访问,确保防火墙放行了80端口,selinux是否关闭。
# 访问时需要输入在上面创建的nagiosadmin账户及密码,htpasswd的配置在
vim /etc/httpd/conf.d/nagios.conf
************************************
<Directory "/usr/local/nagios/sbin">
   ...
   AuthName "Nagios Access"
   AuthType Basic
   AuthUserFile /usr/local/nagios/etc/htpasswd.users
   Require valid-user
   ...
</Directory>

...

<Directory "/usr/local/nagios/share">
   ...
   AuthName "Nagios Access"
   AuthType Basic
   AuthUserFile /usr/local/nagios/etc/htpasswd.users
   Require valid-user
</Directory>
************************************
2. nrpe方式监控理论说明
2.1 linux主机监控简介
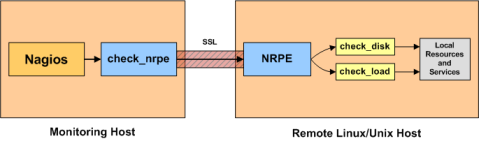
监控linux主机有多种方法,其中一种是使用SSH keys和check_by_ssh插件(这里不介绍),另外一种常用的方法是使用NRPE附加功能。
NRPE原理图
3. 配置文件
3.1 准备自定义配置环境
# 在主配文件中,配置自定义配置所在目录
vim /usr/local/nagios/etc/nagios.cfg
*************************************************
cfg_dir=/usr/local/nagios/etc/selfconf
*************************************************

# 或者,也可以自定义单独的配置文件名称
cfg_file=/usr/local/nagios/etc/objects/***.cfg

# 另外,要确保配置文件的后缀名称是cfg

mkdir /usr/local/nagios/etc/selfconf
4. 主机和主机组
4.1 创建一个自定义主机与主机组
vi /usr/local/nagios/etc/selfconf/hosts.cfg
************************************************
define host{
        use             generic-host
        host_name       host01
        alias           Some Remote Host
        max_check_attempts 5
        address         10.10.180.17
        hostgroups      allhosts
        }

define hostgroup{
        hostgroup_name          allhosts
        alias                   All Servers
        members                 host01
        }
************************************************
use: 指定继承哪一个模版的配置; 配置在/usr/local/nagios/etc/objects/templates.cfg中host_name: 主机名称alias: 关联在此主机的一个长名称address: 主机的ip地址hostgroups: 指定此主机归属的主机组
5. 配置服务
5.1 创建一个自定义服务
vi /usr/local/nagios/etc/selfconf/services.cfg
************************************************
define service{
        use                     generic-service
        host_name               remotehost
        service_description     HTTP
        check_command           check_http
        }
************************************************
use: 指定继承哪一个模版的配置; 配置在/usr/local/nagios/etc/objects/templates.cfg中hostname: 主机名称service_description: 服务描述check_command: 使用命令的名称
检查一下check_http命令
vi /usr/local/nagios/etc/objects/commands.cfg
************************************************
define command{
        command_name    check_http
        command_line    $USER1$/check_http -I $HOSTADDRESS$ $ARG1$
        }
************************************************
通过下面的扩展链接,可以看到还有FTP\SMTP\IMAP\POP3\SSH等服务的检查,当然通过自己写命令脚本,还可以扩展很多服务
6. 检查nagios配置
6.1 重启服务
# 检查配置
/usr/local/nagios/bin/nagios -v /usr/local/nagios/etc/nagios.cfg
...
Total Errors:   0

Things look okay - No serious problems were detected during the pre-flight check

# 重启服务
service nagios restart
7. 被监控端部署nrpe
7.1 被监控端安装nrpe
# 创建nagios用户
useradd nagios
passwd nagios

# 下载并安装nagios plugin
cd /usr/local/src/
wget https://nagios-plugins.org/download/nagios-plugins-2.1.1.tar.gz
tar zxf nagios-plugins-2.1.1.tar.gz
cd nagios-plugins-2.1.1
./configure --prefix=/usr/local/nagios
make
make install
chown -R nagios:nagios /usr/local/nagios

# 安装xinetd
yum install xinetd

# 下载并安装nrpe
wget http://superb-sea2.dl.sourceforge.net/project/nagios/nrpe-2.x/nrpe-2.15/nrpe-2.15.tar.gz
tar zxvf nrpe-2.15.tar.gz
cd nrpe-2.15
yum install openssl-devel openssl -y
./configure --enable-ssl --with-ssl-lib
make all
make install-plugin
make install-daemon
make install-daemon-config
make install-xinetd

# 配置nrpe daemon的监控端ip地址
vim /usr/local/nagios/etc/nrpe.cfg
**********************************************
allowed_hosts=127.0.0.1,10.10.180.11
# ip地址是监控端服务器的ip,这里是逗号间隔
**********************************************

vim /etc/xinetd.d/nrpe
**********************************************
only_from       = 127.0.0.1 10.10.180.11
# ip地址是监控端服务器的ip,这里是空格间隔
**********************************************

# 配置nrpe daemon的端口
vim /etc/services
***********************************************
nrpe            5666/tcp
***********************************************

# 重启xinted服务
service xinetd restart

# 检查连接
/usr/local/nagios/libexec/check_nrpe -H localhost
CHECK_NRPE: Error - Could not complete SSL handshake.
# 原来是因为并没有把localhost写进nrpe的两个配置文件中,添加localhost,并重启xinetd服务后可成功得到返回结果

/usr/local/nagios/libexec/check_nrpe -H localhost
NRPE v2.15

/usr/local/nagios/libexec/check_nrpe -H 127.0.0.1
NRPE v2.15
8. 监控服务端部署nrpe
8.1 监控端安装nrpe
#下载并安装nrpe
cd /usr/local/src/
tar zxf nrpe-2.15.tar.gz
cd nrpe-2.15
yum install openssl-devel openssl -y
./configure --enable-ssl --with-ssl-lib
make all
make install-plugin

# 检查连接
/usr/local/nagios/libexec/check_nrpe -H 10.10.180.17
NRPE v2.15

# 配置nrpe命令
vim /usr/local/nagios/etc/objects/commands.cfg
*********************************************
define command{
        command_name check_nrpe
        command_line $USER1$/check_nrpe -H $HOSTADDRESS$ -c $ARG1$
        }
*********************************************

# 编辑原来的service配置文件
vim /usr/local/nagios/etc/selfconf/services.cfg
*********************************************
check_command           check_nrpe!check_http
# 将check_http传给check_nrpe来执行
*********************************************
8.2 错误
错误信息
后来web页面检查的时候,此命令运行失败,报错:NRPE: Command ‘check_http’ not defined
问题原因
原来是被监控端的nrpe.cfg中没有定义check_http
解决方案
# 被监控端,确保check_http命令存在
ls /usr/local/nagios/libexec/check_http
# 配置nrpe.cfg
vim /usr/local/nagios/etc/nrpe.cfg
*********************************************
command[check_http]=/usr/local/nagios/libexec/check_http -I 127.0.0.1
*********************************************

service xinetd restart

/usr/local/nagios/libexec/check_nrpe -H localhost -c check_http
HTTP OK: HTTP/1.1 200 OK - 844 bytes in 0.010 second response time |time=0.010375s;;;0.000000 size=844B;;;0
9. 扩展资料
9.1 扩展链接
- 主机组、服务等配置:https://assets.nagios.com/downloads/nagioscore/docs/nagioscore/4/en/monitoring-publicservices.html
- nrpe安装配置:https://assets.nagios.com/downloads/nagioscore/docs/nrpe/NRPE.pdf
10. 配置汇总
10.1 hosts.cfg
主机配置文件,在这个配置文件里添加主机,格式如下:
define host{
        host_name pangu-server #主机名
        alias pangu-server #主机名别名
        address 10.10.10.11 #主机的IP地址
        check_command check-host-alive #检查的命令,在command.cfg定义的
        max_check_attempts 1 #失败时尝试检测最大次数,值为1时只报警不重新检测
        check_period 24x7    #检查的时间段,24X7是每天都检查
        contact_groups admins-cms #联系人组,报警后发邮件给哪个组,这里是发送给admins-cms,在contactgroups.cfg定义的
        notification_interval 1 #  重发电子邮件通知时间间隔
        notification_period 24x7 # 发送邮件的时间段,24X7是任意时间断都发送邮件报警
        notification_options d,u,r # 发送报警的选项,d表示down,u表示up,r表示restore,表示这3种情况下发送报警
        process_perf_data 1  #其值可以为0或1,其作用为是否启用Nagios的数据输出功能,如果将此项赋值为1,那么Nagios就会将收集的数据写入某个文件中,以备提取
}
10.2 hostgroups.cfg
主机组配置文件,可以将主机添加到组里,格式如下:
define hostgroup{
        hostgroup_name pangu #主机组名
        alias pangu #主机组名别名
        members pangu-server #组内成员,也就是在hosts.cfg定义的主机
}
10.3 commands.cfg
命令配置文件,定义服务的时候会用到,格式如下:
define command {
        command_name check-host-alive #命令名
        command_line $USER1$/check_ping -H $HOSTADDRESS$ -w 3000.0,80% -c 5000.0,100% -p 5 #具体的命令行
}
10.4 services.cfg
服务配置文件,定义主机服务,格式如下:
define service{
        hostgroup_name pangu #主机组名,给哪个组定义服务
        service_description Check /data1 Partition # 定义的服务名,也是Nagios前端显示名称
        check_command nrpe!check_my_disk!10% 8% /data1 #检查服务的命令,在commands.cfg定义
        process_perf_data 1  #其值可以为0或1,其作用为是否启用Nagios的数据输出功能,如果将此项赋值为1,那么Nagios就会将收集的数据写入某个文件中,以备提取
        max_check_attempts 2  #失败时尝试检测最大次数,值为1时只报警不重新检测
        normal_check_interval 15  #正常检查间隔
        retry_check_interval 1 # #重试检查间隔
        check_period 24x7   #检查的时间段,24X7是每天都检查
        notification_interval 15  #重发电子邮件通知时间间隔
        notification_period 24x7   # 发送邮件的时间段,24X7是任意时间断都发送邮件报警
        notification_options w,u,c,r  # 发送报警的选项,w表示warning,d表示down,u表示up,r表示restore,表示这4种情况下发送报警
        contact_groups admins,admins-cms # 联系人组,报警后发邮件和短信给哪个组,这里是发送给admins-cms,在contactgroups.cfg定义的
}
10.5 escalation.cfg
报警限制配置文件,格式如下,这里主要是避免长时间发短信报警,从第4次短信报警就采用发邮件方式
define serviceescalation{
        host_name pangu-web-102 #主机名也可以是主机组
        service_description Check Phplog Num  #服务名
        first_notification 4   #从第几次短信开始
        last_notification 0
        notification_interval 10 #重发电子邮件通知时间间隔
        contact_groups admins,webadmin #发送邮件的组
}